Visual Exploration of Time-Series Forecasts Through Structured Navigation
Abstract
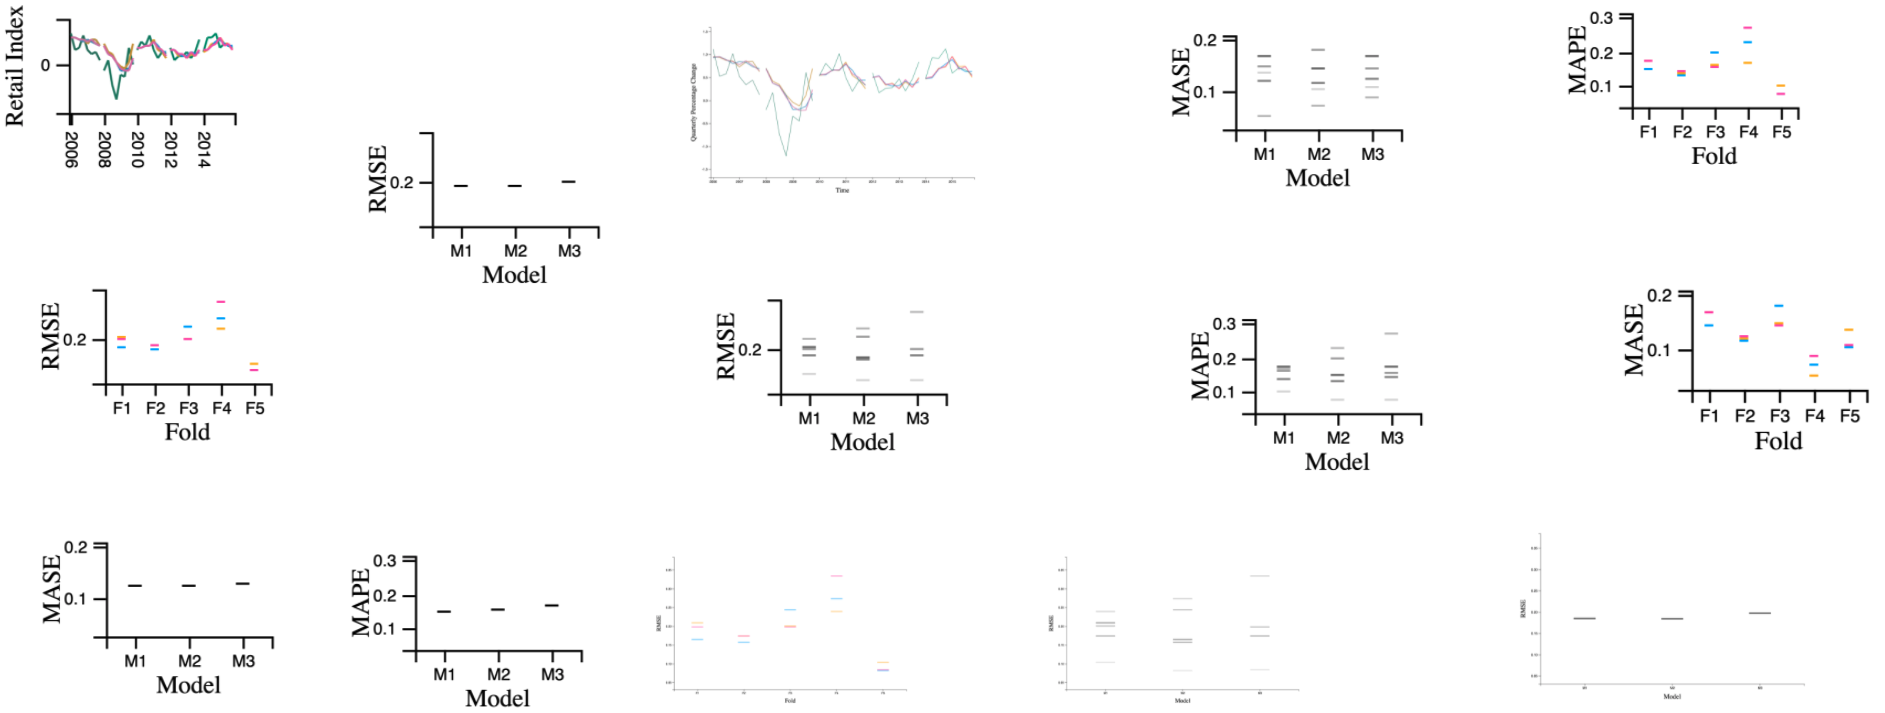
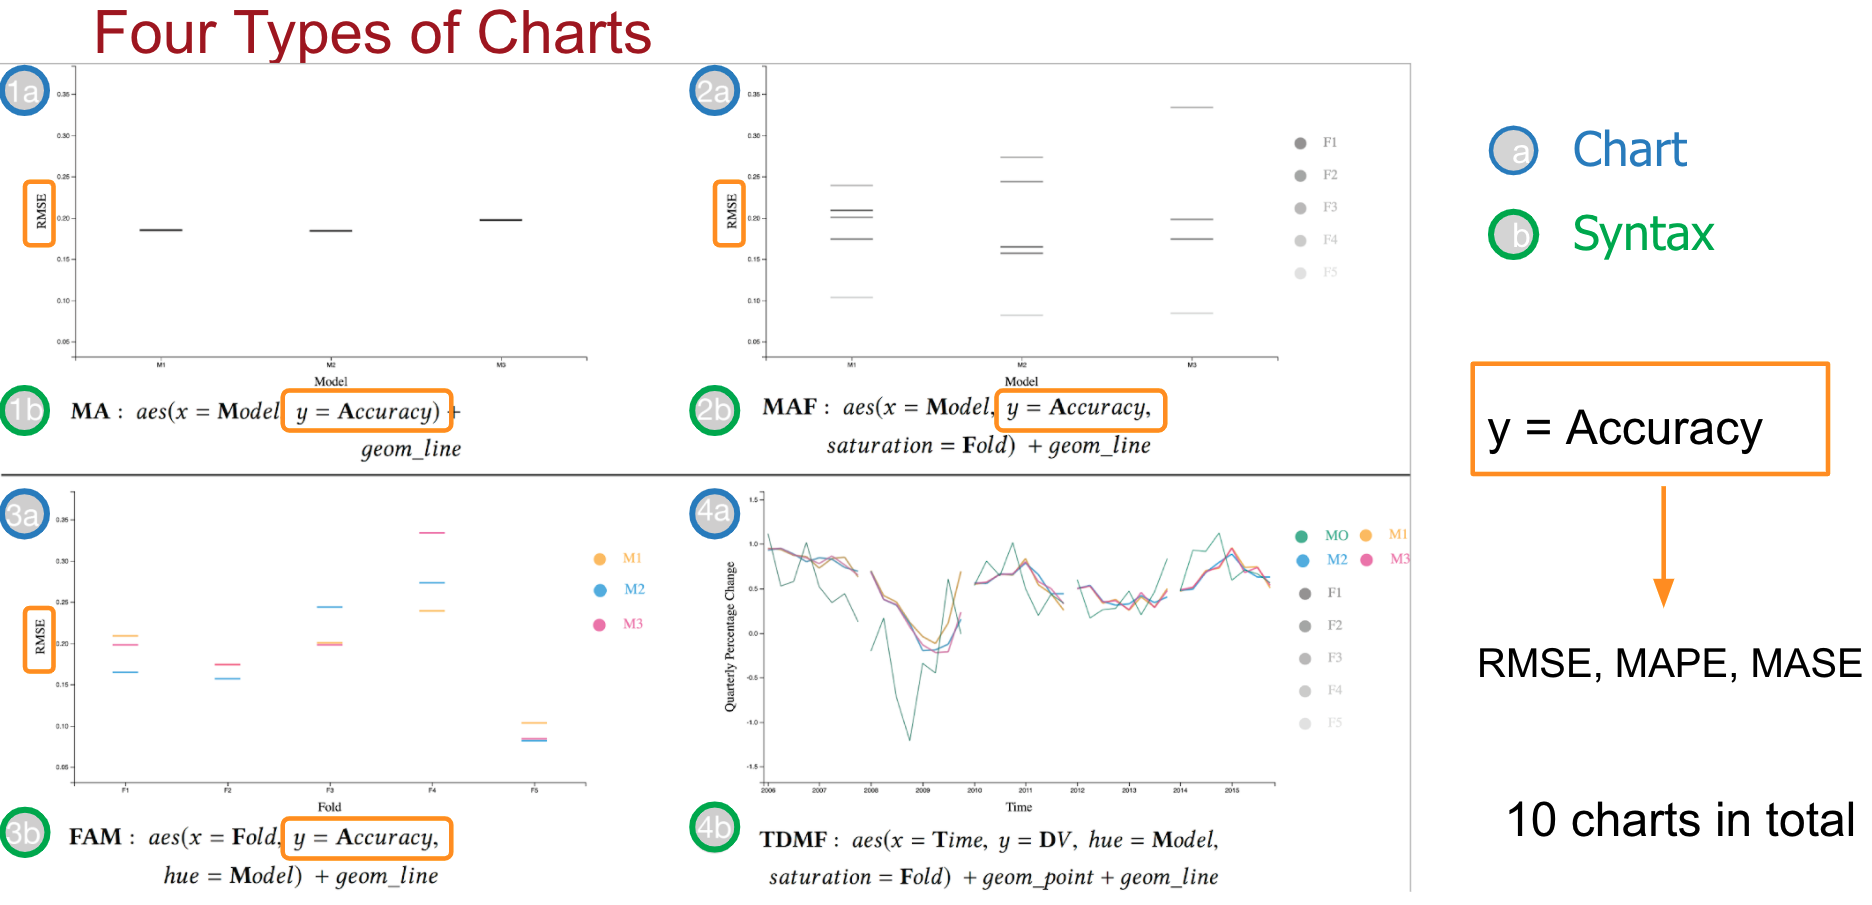
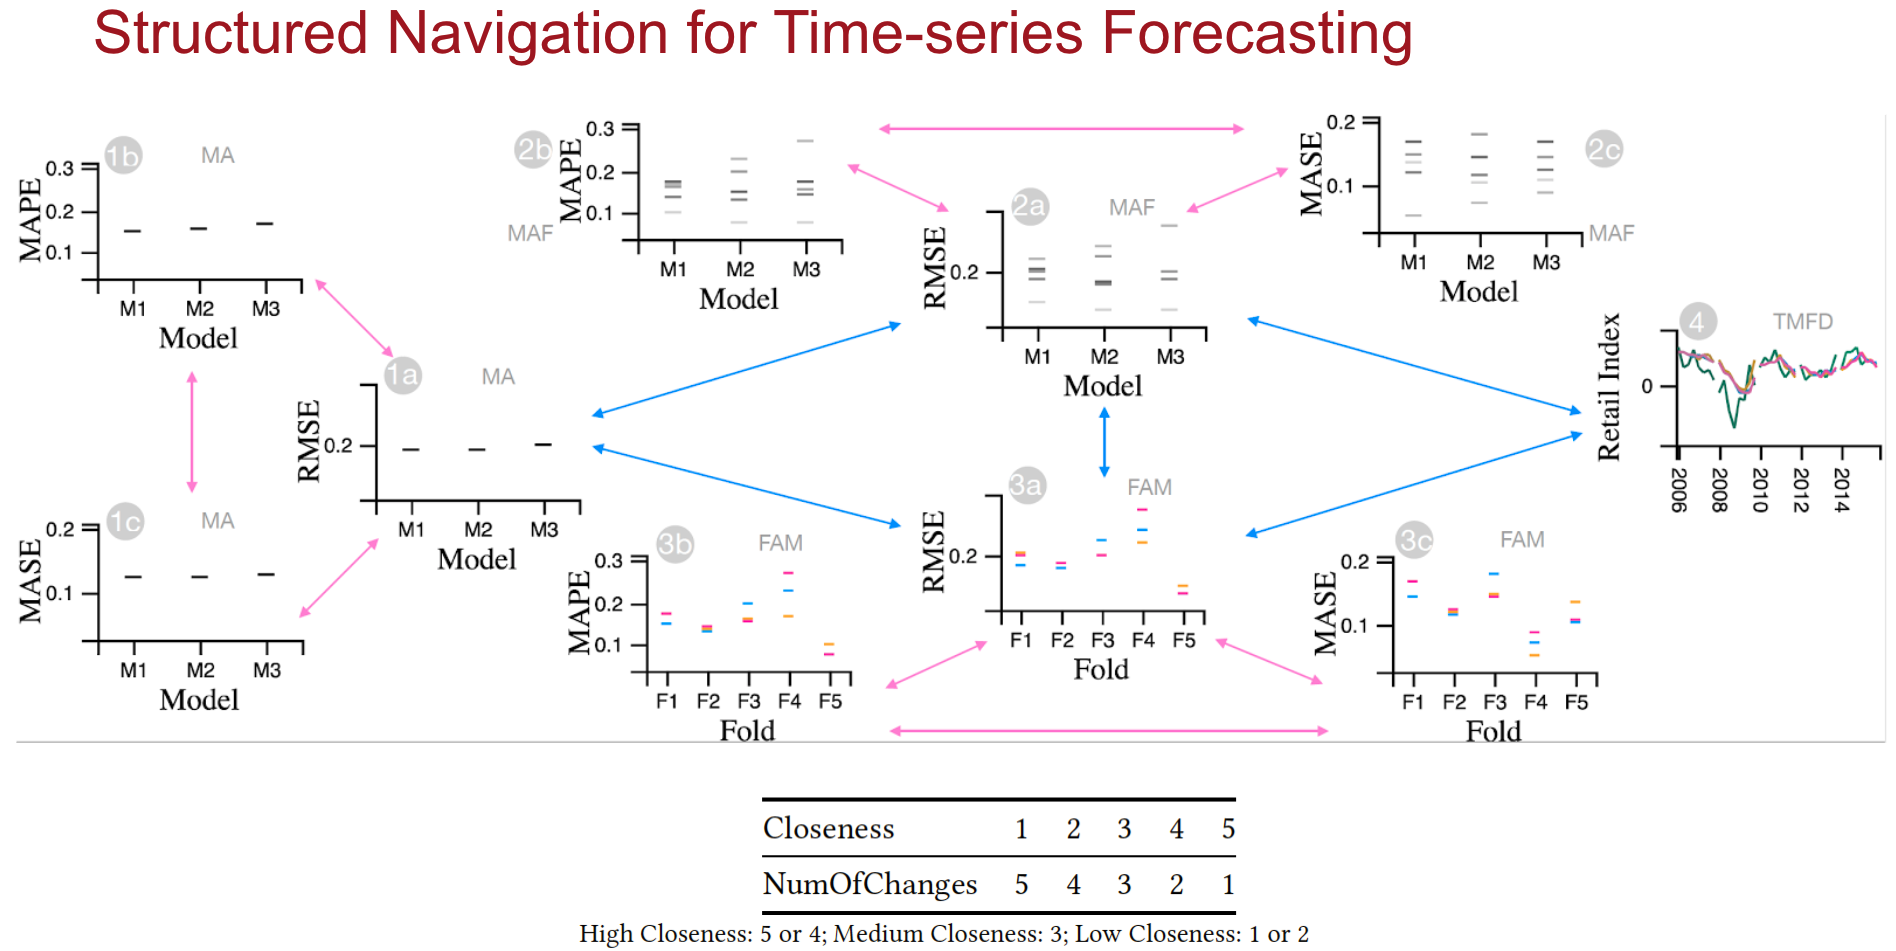
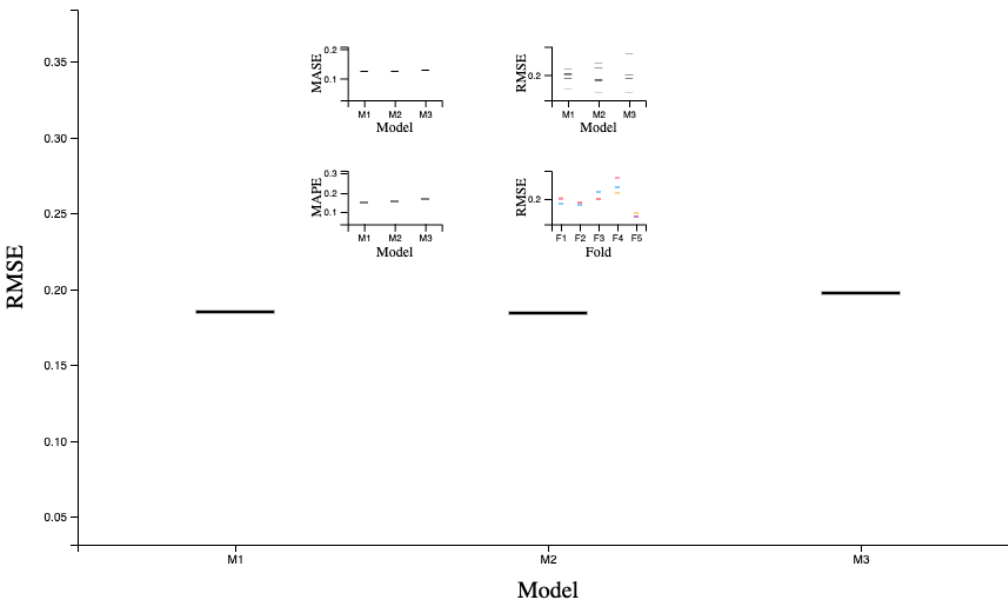
Evaluating the forecasting ability of time-series involves observations of multiple charts representing different aspects of model accuracy. However, the sequence of the charts observed by users is not controlled and it is difficult for users to discover relations among charts. Therefore, we propose a method for constructing a navigation structure that shows these relations based on the syntax and semantics of the charts. An excerpt from the structure is used as a context menu that allows users to navigate through a series of charts and explore their relations in a structured way. A qualitative study is conducted to evaluate the system and the results show that our approach helps explore connections among charts and enhances the understanding of time-series forecasting performance.
Key Words: Model evaluation, navigation, time series, visual analytics, HCI, machine learning
Xiaoyi Wang and Kasper Hornbæk. 2020. Visual Exploration of Time-Series Forecasts Through Structured Navigation. In Proceedings of the International Conference on Advanced Visual Interfaces (AVI '20). Association for Computing Machinery, New York, NY, USA, Article 38, 1–9.